
Debug sessions
A debug session is a temporary authorization to access execution traces on the data plane. It lets you see which API calls your MCP server actually executes, what responses it receives, and how it produces its final output. Sessions last 4 hours max and only one can be active at a time.
Start a debug session #
Go to your MCP server settings and create a new session.
Send requests using the MCP server #
After starting a session, you can analyze requests sent by your AI tool. For debug/QA, we recommend using MCPJam, a free MCP testing platform.
Send requests using cURL #
You can also directly send requests using cURL. From the debug session page, select a tool to get a pre-filled cURL command. The request uses 4 variables:
ORGANIZATION_SLUG: your Bump.sh organization slug.MCP_SERVER_SLUG: your MCP server slug.DEBUG_TOKEN: your unique session token.TOOL_NAME: the tool to debug, as defined in your workflow file.
If the workflow requires inputs, you can pass them in two ways.
As query parameters (simplest, with a GET request):
$ curl \
  --request GET "run.bump.sh/$ORGANIZATION_SLUG/$MCP_SERVER_SLUG/debug/$TOOL_NAME?city=paris&format=celsius" \
  --header "Authorization: Token $DEBUG_TOKEN"
As a JSON body (with a POST request):
$ curl \
  --request POST "run.bump.sh/$ORGANIZATION_SLUG/$MCP_SERVER_SLUG/debug/$TOOL_NAME" \
  --header "Authorization: Token $DEBUG_TOKEN" \
  --header "Content-Type: application/json" \
  --data '{"city": "paris", "format": "celsius"}'
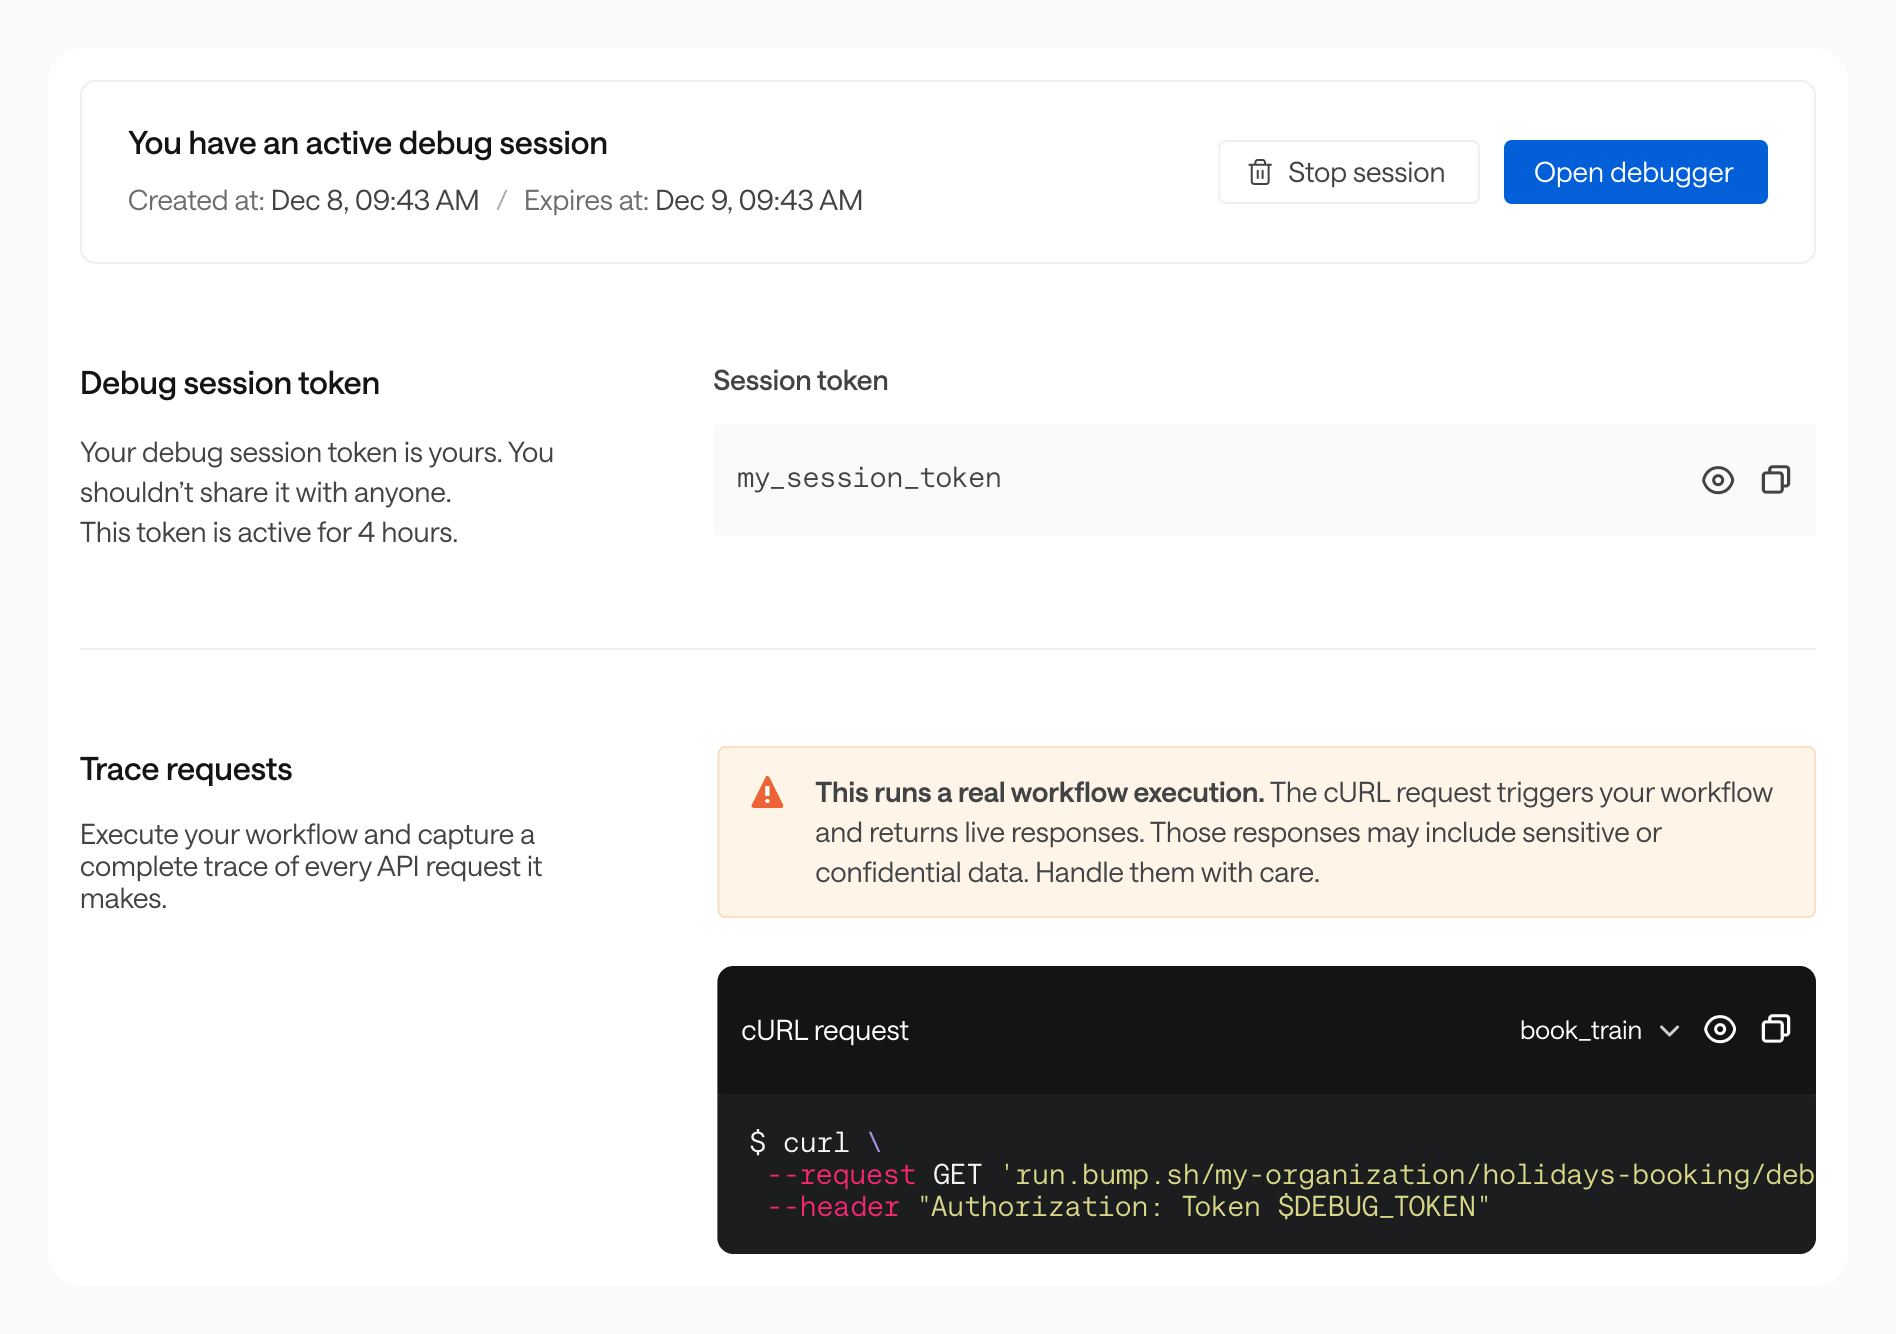
Debug sessions run on the production environment. Responses may include sensitive data. Handle them with care.
Read the response #
Using the visual debugger #
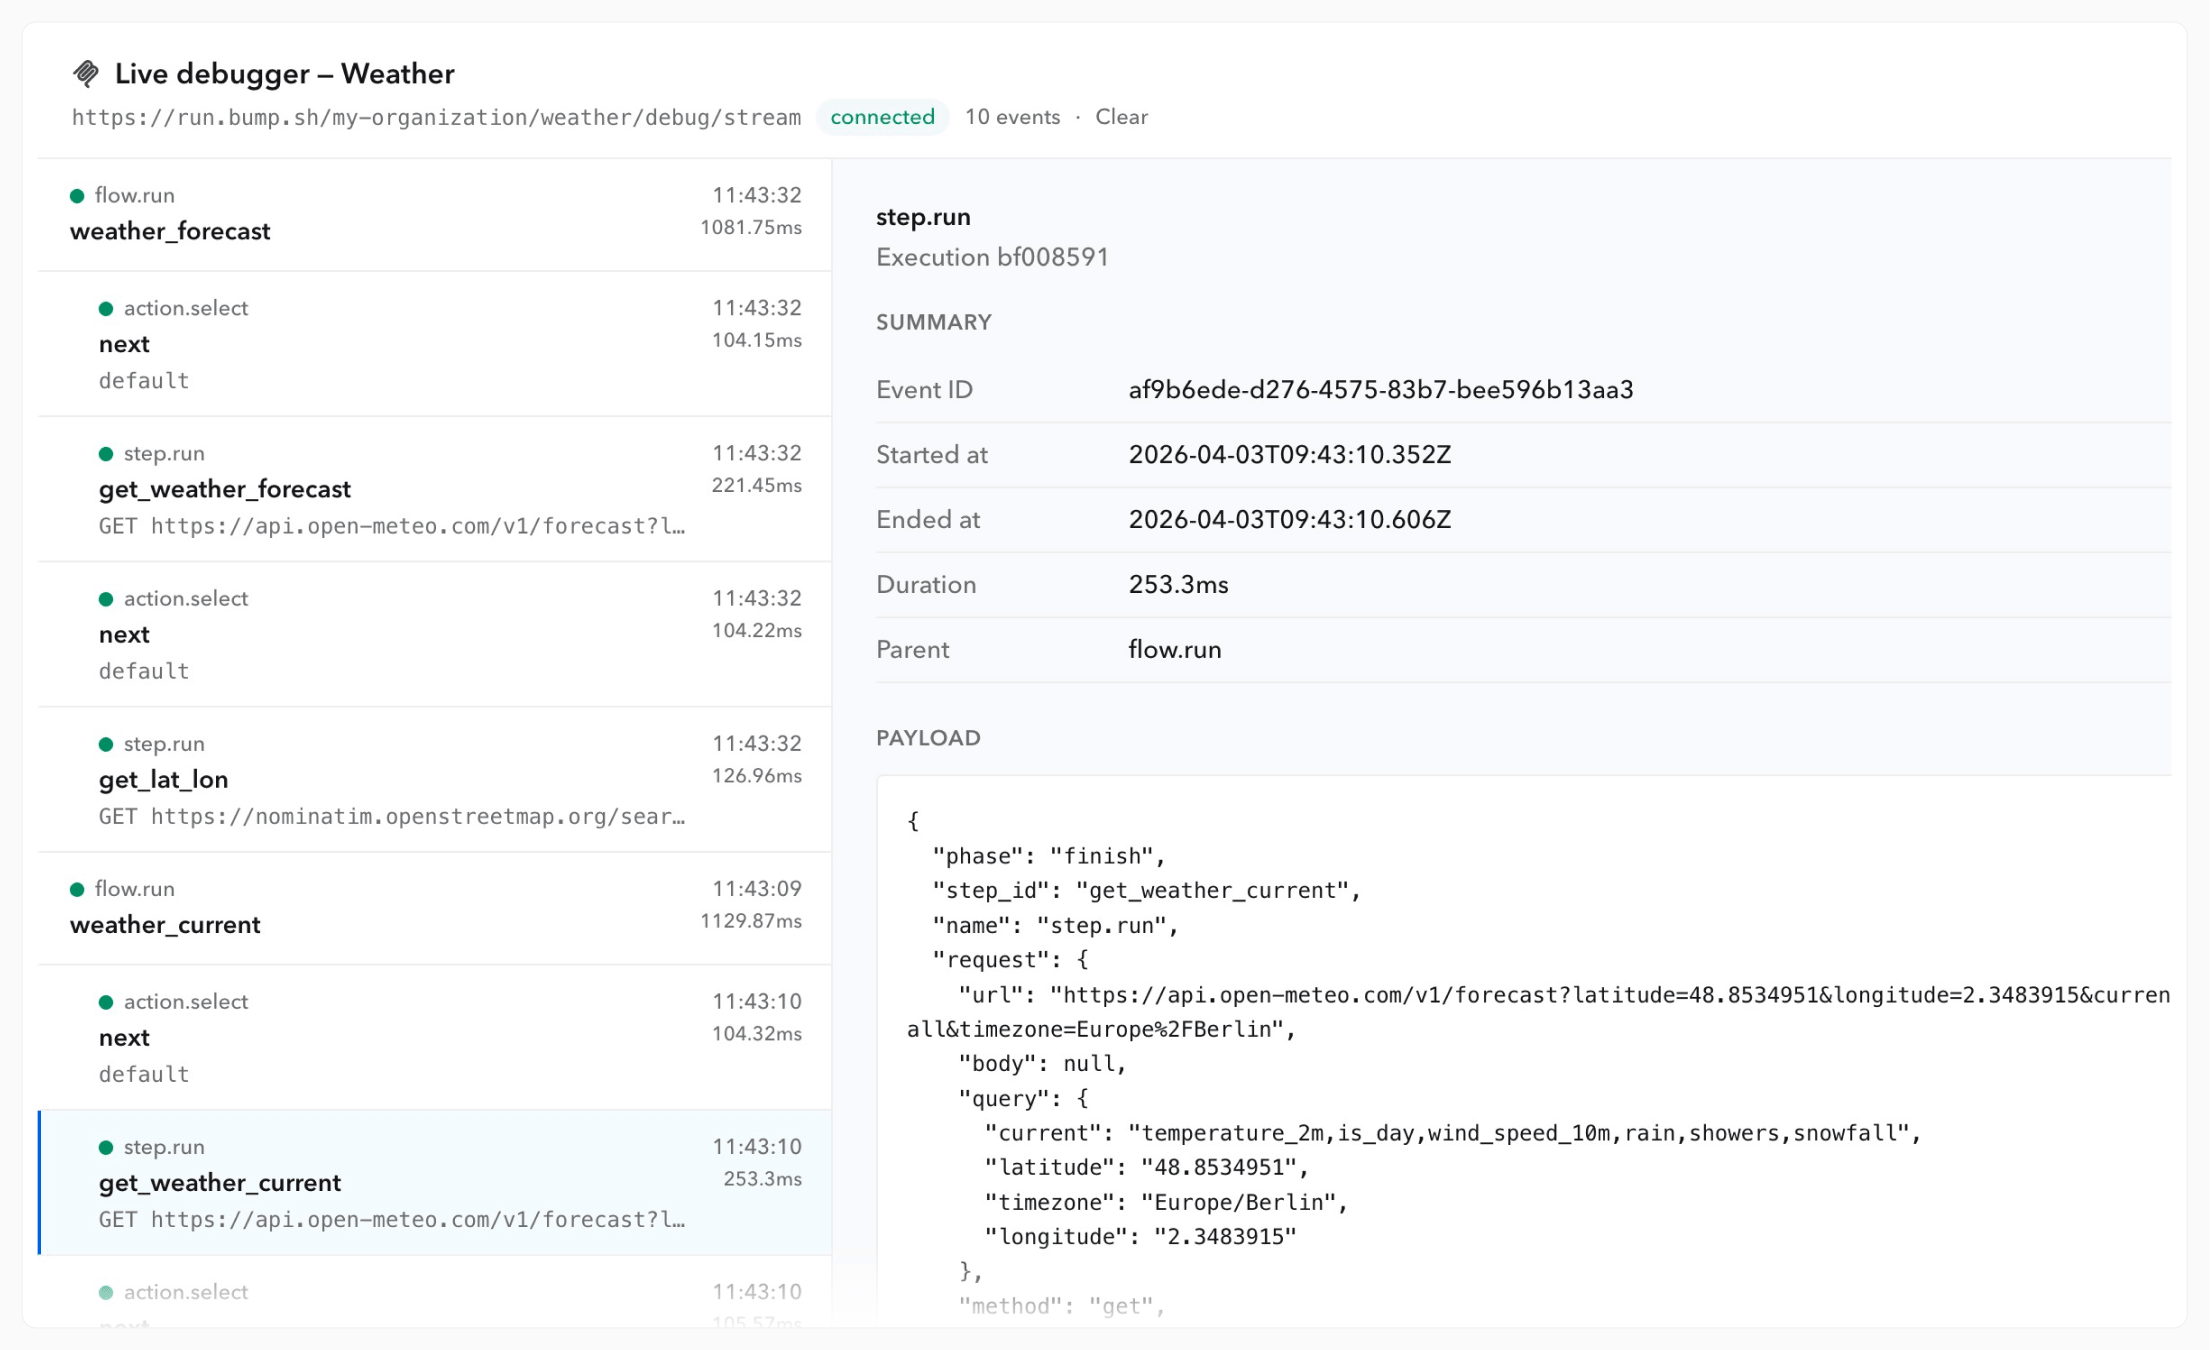
The visual debugger allows you to visually analyze workflow’s execution made by an MCP request. To access it, click on “Open debugger” from the Debug sessions page.
It returns the same level of information as the debug endpoint. trace content detailed here.
Using the debug endpoint #
The debug endpoint returns a JSON object with two keys:
outputs: the final values returned to the AI agent after running the workflow.trace: the full execution trace, showing every step the data plane ran.
Start by looking at outputs. If the values are wrong or missing, dive into the trace to find where things went wrong.
Understand the trace #
The trace object returned in cURL contains all the information about the workflow’s execution. The visual debugger structures and renders its content. You’ll find:
- Flow-level inputs and outputs: what the workflow received and what it returned.
- Steps (
step.run): each HTTP request the data plane executed, with the full request (method, URL, query, body) and the API response (status, body). - Actions (
action.run): flow control decisions between steps. If your workflow uses conditions (retry, goto, end), this is where they are evaluated.
Example #
Here is a shortened trace from our Weather MCP server. The workflow resolves a city name to coordinates, then fetches the current weather.
{
"outputs": {
"temperature": "18.2 °C",
"rain": "0.0",
"snowfall": "0.0"
},
"trace": {
"name": "flow.run",
"duration_ms": 181.44,
"flow_id": "weather_current",
"inputs": {
"city": "paris"
},
"outputs": {
"temperature": "18.2 °C",
"rain": "0.0",
"snowfall": "0.0"
},
"children": [
{
"name": "step.run",
"duration_ms": 61.2,
"step_id": "get_lat_lon",
"request": {
"method": "get",
"url": "https://nominatim.openstreetmap.org/search?q=paris&format=jsonv2",
"query": { "q": "paris", "format": "jsonv2" }
},
"response": {
"status": 200,
"body": [
{ "lat": "48.8534951", "lon": "2.3483915", "name": "Paris" }
]
}
},
{
"name": "action.run",
"duration_ms": 0.13,
"action": { "type": "next" }
},
{
"name": "step.run",
"duration_ms": 118.45,
"step_id": "get_weather_current",
"request": {
"method": "get",
"url": "https://api.open-meteo.com/v1/forecast?latitude=48.8534951&longitude=2.3483915¤t=temperature_2m,rain,snowfall",
"query": {
"latitude": "48.8534951",
"longitude": "2.3483915",
"current": "temperature_2m,rain,snowfall"
}
},
"response": {
"status": 200,
"body": {
"current": {
"temperature_2m": 18.2,
"rain": 0.0,
"snowfall": 0.0
}
}
}
},
{
"name": "action.run",
"duration_ms": 0.12,
"action": { "type": "next" }
}
]
}
}
Security and access #
Trace data is not persisted. Nothing is stored between requests.
Maintainers, admins, and owners of your organization can create debug sessions. Session activity is visible on the history page.
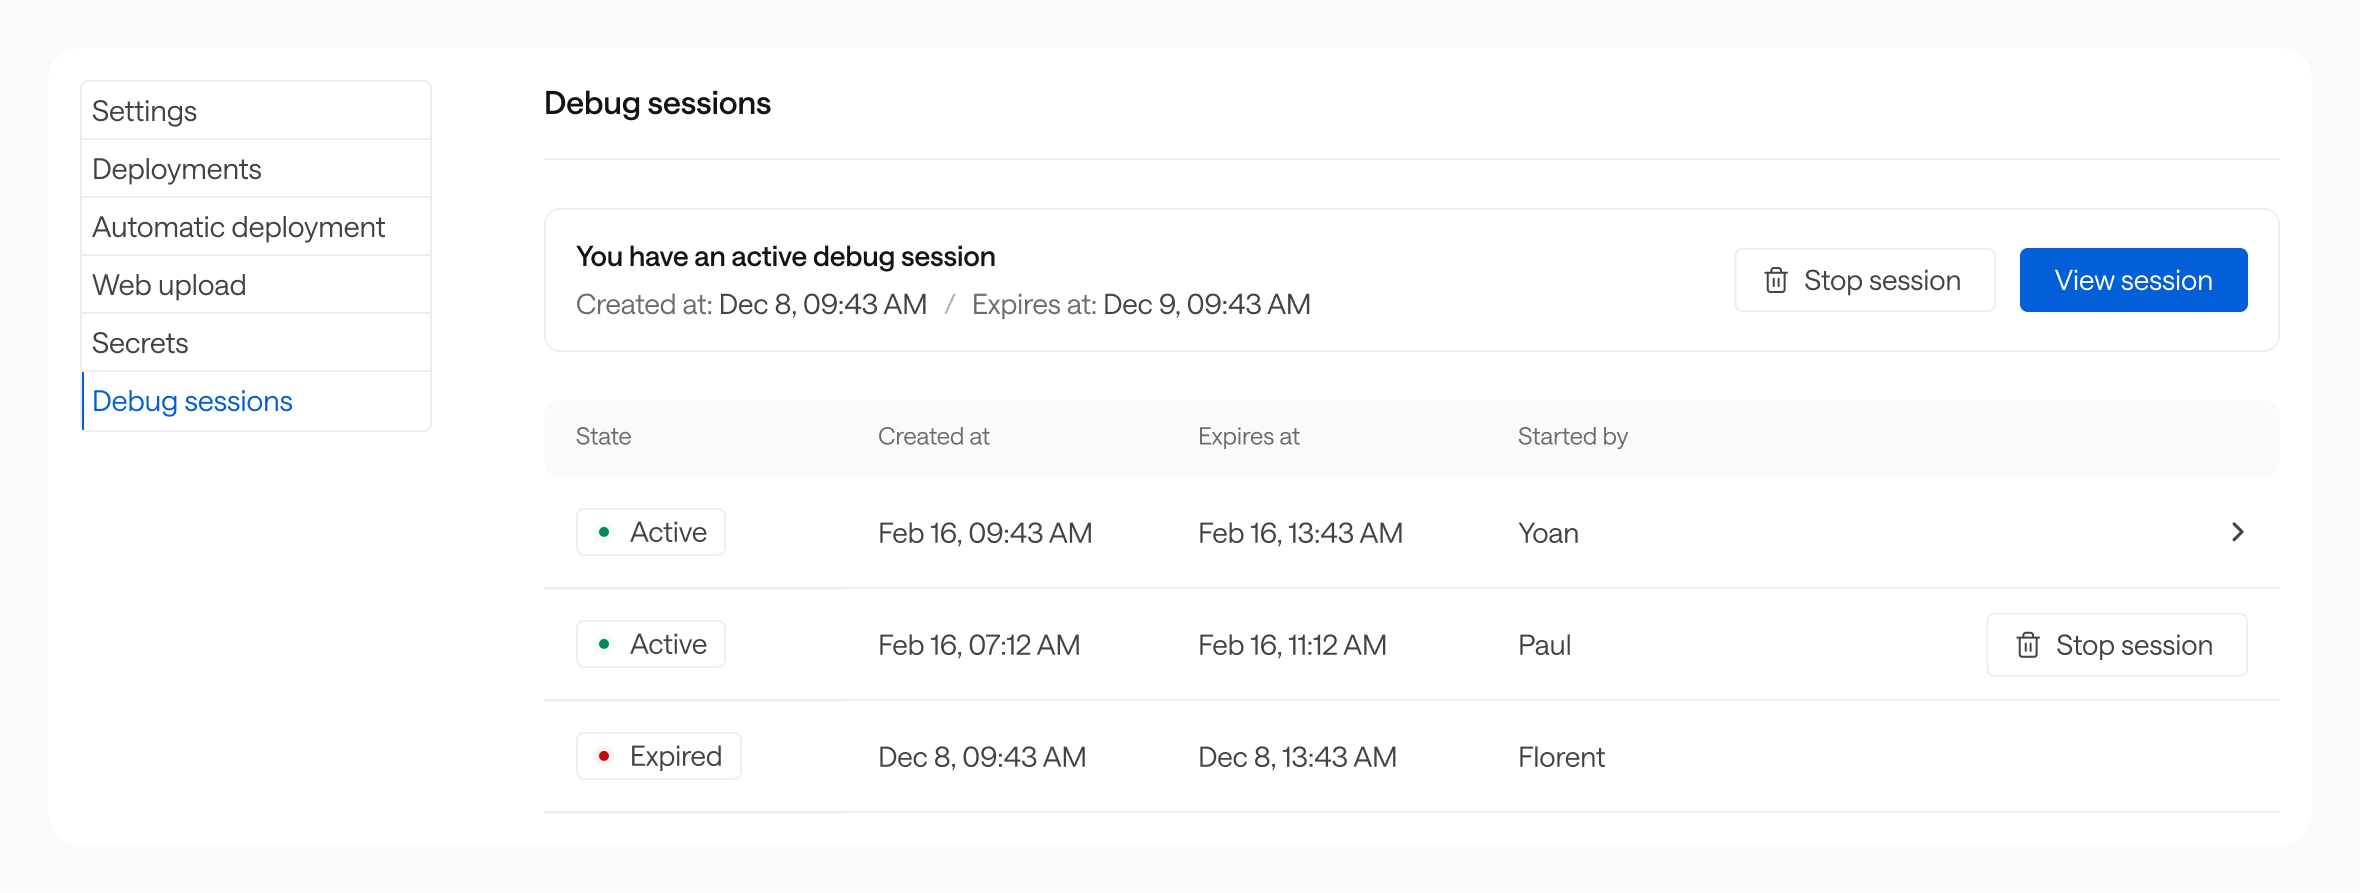
Admins and owners can stop other members’ sessions.